Posts Tagged ‘temperature’

Cold water, big tides

January 12, 2017

After a very cold night, there was a layer of ice on Pedder Bay again this morning which allowed for some interesting observations and data collection by marine scientists.

ice-fragments

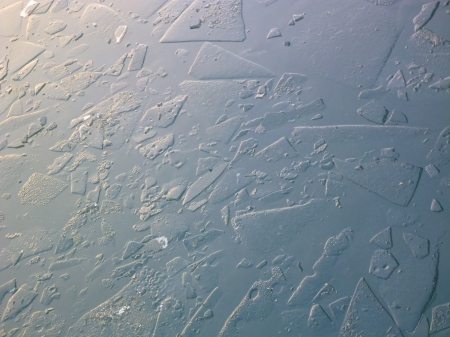
Data below were collected by second year Marine Science students at two different times of the morning.
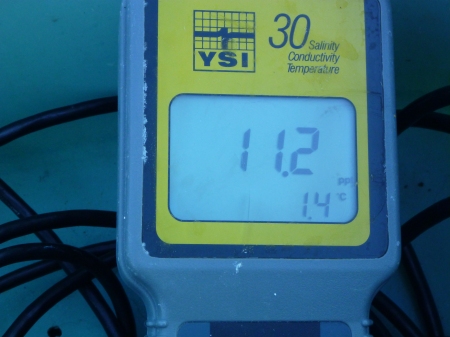
8:05 am 11:00 am
Depth (m) Temp (oC) Salinity (ppt) Temp (oC) Salinity (ppt)
0 3.7 28.4 4.6 25.9
0.5 5.8 29.3 5.8 30.1
1.0 6.4 30.3 6.7 30.6
2.0 6.7 30.6 6.7 30.7
3.0 6.7 30.7 6.8 30.8
4.0 6.8 30.7 6.9 30.8
5.0 6.8 30.7 6.9 30.8

One major conclusion can be drawn:

The water is COLD (right down to 5 m where we usually measure temperatures around 10oC). It is so cold that students’ tongues are turning blue:

31413566224_daa3da4af1_k

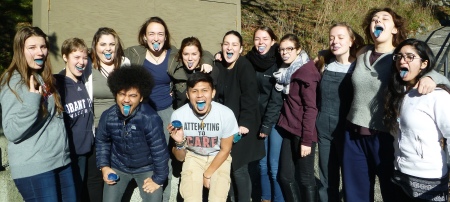
Wait a minute… the cold is not the reason for the blue tongues in these Biology students!

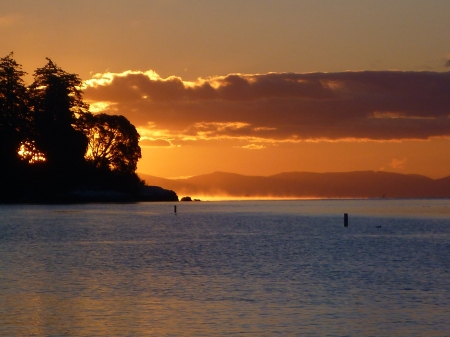
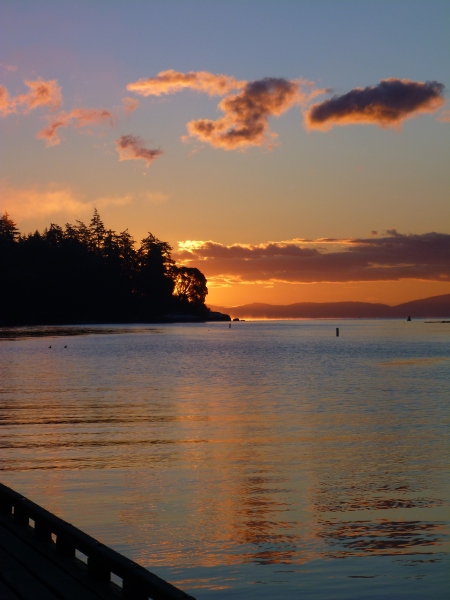
We are also experiencing big tides these days (2.8 m tidal range). High tides in the early afternoon:

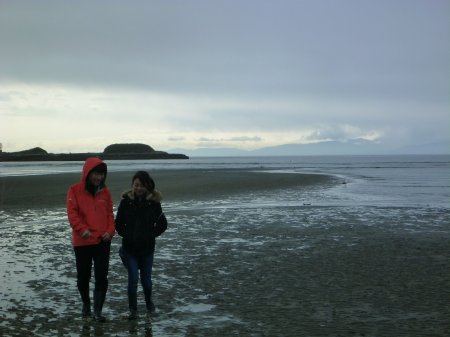
Then low tides at night:

low-tide

Emilio, Heather & Millie at low tide (20:15 11 Jan 2017)

Interesting times!

Pedder Bay pancakes

January 4, 2017

Pancake ICE, that is!

Defined in a sea ice glossary as “Predominantly circular pieces of ice from 30 centimeters to 3 meters in diameter, and up to about 10 centimeters in thickness with raised rims due to pieces striking against one another. It may be formed on a slight swell from grease ice, shuga, or slush or as a result of the breaking of ice rind, nilas, or under severe conditions of swell or waves, of gray ice.”

Pancake ice is not common in Pedder Bay, but due to many days of cold air temperatures, it is abundant around the Pearson College dock and around the Pedder Bay Marina.

I did a quick measurement of surface salinity (ppt) and seawater temperature (oC):

temp-sal-at-surface

Yikes!! The poor mergansers, their feet must be very cold!

Snow and Sunrise – 6 December 2016

December 6, 2016

31317072402_ded08b102e_o.jpg

After a snowfall last night, a stunning sunrise this morning.

31462990845_2c9c625c0d_o

First year Marine Science students also measured seawater temperature and salinity at 9:40 am while the air temperature was 4.2oC.

Depth (m) Temp (oC) Salinity (ppt)
0.0 7.1 18.0
0.5 9.7 29.7
1.0 9.8 30.0
2.0 9.8 30.0

Brrr….

Wonderful Witty’s

April 21, 2016

Michael with data

Last week as their penultimate field trip, second year Marine Science students explored Witty’s Lagoon as an example of an estuary. We measured water temperature, salinity, and dissolved oxygen at six locations along the estuary. The photo above shows Michael reading out the data that he and Michał collected (seen in the photo below) on Wednesday 13 April.

Measuring

Noemi Kevin

Noëmi and Kevin collected similar data from the same location (‘Log lake’) on the previous day (Tuesday 12 April 2016).

In the photo below, Tamara & Laura collect data from the ‘ocean’ site.

Measuring ocean

Data for all three days shown below:

Screen Shot 2016-04-21 at 12.08.40 PM

Skunk cabbage

The site that we named ‘Skunk cabbage creek’ was very near this beautiful plant.

We also explored the salt marsh and some of its inhabitants – for several students the plants were cool the spiders were not!On the salt marsh

We also found some wonderful invertebrates, both in the estuary and on the sandy beach.

Kohtaro Mary

Temperature & Salinity 13 Nov 2015

November 13, 2015
Depth (m) Temp (oC) Salinity (ppt)
0 10.5 10.4
0.5 9.9 29.4
1.0 9.8 30.4
2.0 9.8 30.7
3.0 9.8 30.7
4.0 9.8 30.7
5.0 9.8 30.8

10:00 am         Pearson College dock

Secchi depth = 1.01 m      Air temp = 15.8oC

Investigating the properties of seawater

December 12, 2014

P1040030Today all three classes of first year marine scientists investigated various properties of seawater. Each student had a research question and hypothesis, designed a method to test their hypothesis then carried out their investigation in class.  In the photo above, Young is investigating the effect of salinity on conductivity and in the photo below Romanos is setting up his experiment to measure the effect of salinity on sea ice melting time.

P1040031P1040039Above, Alana is measuring the effect of bubbling carbon dioxide into the water on the dissolved oxygen in seawater and below, Malou is setting up her experiment which involved increasing salinity with ‘Instant Ocean’.

P1040034P1040041Noemi modified the salinity of seawater samples to mimic the salinities of different seas and measure the effect on boiling point.

P1040043

P1040049Adva, in the photo above, tested the effect of bubbling oxygen gas into seawater on the pH and Sofiya, in the photo below, tested the effect of humidity on dissolved oxygen.

P1040048 P1040047Connor, in the photo above, added drops of solutions with different salinities to the surface of a coin to see if there was an effect of salinity on cohesion / surface tension.

P1040036David Hawley came down to the floating lab and checked out a few of the experiments as part of his last tour of classes as the director of Pearson College. He is on his way to the IBO in the Netherlands very soon.  We will certainly miss his visits to Marine Science classes, but David, please know that you are absolutely welcome to come back any time!

P1040035


Oceanographic expeditions 2014

December 4, 2014

Briefing

The three first year marine Science classes endeavoured to describe and explain the pattern of temperature and salinity in Pedder Bay on Monday 24 November (C block) and Tuesday 25 November (D and F blocks).

Wet wet wet

Many abiotic factors were measured…

TS measuring Sofiya

TS measuring

including, of course, temperature and salinity…

Air temp Dom

Air temp Alashua

…air temperature and relative humidity…

Secchi

…Secchi depth…

Wind Ruli

…and wind speed.

Messenger prep

F block students also sampled at 30 m using a Niskin bottle and messenger.

Data record Sowmya Data record Mary

Data were recorded and subsequently analysed back on solid ground.

I suspect that the highlight for the two classes on Tuesday was not that the temperature and salinity were unchanging from the surface to depth at the more distant sites, but the humpback whale(s) that were sighted!!

Humpback back

Humpback flukeThanks to Alana and Ali for photos.


Oceanography in Pedder Bay 2013

November 28, 2013

On Monday 25 November, first year marine scientists set out to “describe and explain the spatial variation in temperature and salinity in Pedder Bay”.

Heading out

They measured and recorded temperature and salinity, at six locations within Pedder Bay and at each location, every meter from the surface to the sea floor (or to a maximum of 30 m).

Using TS meterCarrie TS meter


Martin, however, doesn’t seem to understand how the temperature-salinity probe works:

Martin singing


Students also measured a variety of abiotic factors including: wind speed,Alfredo wind meter


water depth, latitude and longititude,Riikka recording


air temperature, relative humidity and illumination.Anna Chloe StuartLabquest


After much discussion and some independent contemplation, Ha Zeena Yam CamilleMeybis

Jessica

Chloe at the wheelthe conclusions include that surface water is warmer and slightly more salty at the mouth of Pedder Bay and there is no variation in water temperature or salinity from the surface to 30 m at the mouth of the bay.D on 2nd Nature

Thanks to Camille RW & Alfredo for photos!

Liquid Layering Lab

November 18, 2013

Liquid layers

Although it may be a bit tricky to see in all the tubes above, there should be four coloured layers of water – each layer with a different density.

Students were challenged to use coloured water of differing temperature and salinity to make the layers.

Hot liquids

Cold liquids


Liquid layers2


If you look closely, you should see a yellow layer between the red and green layers below.

Liquid layers3

Window layers


Thanks to Alfredo for the photos!

What a day in Pedder Bay!

October 2, 2013

Yesterday was the first day of October and there was an incredible amount of animal activity around Pedder Bay.

GBH

GBH on ramp

The first animal of note was a Great Blue Heron (Ardea herodias) on the ramp down to the Pearson College dock.  It was very distracting to Marine Science students…

Distracted

At the same time the heron was making its way down to the dock, three mink also scrambled down towards the water. Since it was difficult to keep the class focused, we went down to the dock and checked the succession substrates that were suspended over one year ago.

Succession1 Succession2

Lots of bryozoans, hydrozoans and several crescent gunnels (Pholis laeta).

While down at the dock, second year marine scientists noticed a hooded nudibranch (Melibe leonina) drifting around at the surface.

Melibe

Not a great photo or video footage but a very cool little watermelon-smelling organism!  Cool enough to have a song written about it by Hanne and Killaq.

Slug song

First year marine scientists measured the variation in temperature and salinity off the Pearson College dock after big rainfall during the weekend.

Depth (m) Temperature (oC) Salinity (ppt)
0 11.3 11.9
0.5 10.7 30.6
1 10.5 30.8
2 10.5 30.9
3 10.4 30.9
4 10.5 31.0
5 10.5 29.7
6 10.5 29.0

While collecting these data we spotted some further animal activity at the mouth of Pedder Bay:

Submarine1

Submarine2

A submarine being escorted to the Navy dock.  What a day!